One year ago, headlines warned about the possibility of lockdown: “Life on Hold for Three Months” gasped one. A bucketful of hindsight later we now know what wishful thinking that was, having slogged through a year where the pandemic transformed our daily lives beyond recognition. This lockdown birthday serves as a useful marker to reflect on what we’ve been through. For one, it’s important to recognize that some people have inevitably been hit harder by the pandemic than others. Just as there are considerable differences in mortality rates, so will there be differences in wellbeing. Increased economic uncertainty was never going to worry the wealthy as much as the poor, and restricted social contact wasn’t going to make shacked-up couples feel as isolated as singletons. So how did the pandemic actually impact happiness in the UK?
While the media has tried to shine a light on the challenges felt by specific social groups, this has been based on anecdotes and speculation, leaving reports about the pandemic feeling paradoxical at times. We heard both about the terrible social isolation, but also the remarkable sense of solidarity and community; from those yearning for a hug to those discovering their neighbours had names on the new Whatsapp street group for the first time. So empirical questions remain: How did people’s sense of loneliness actually change during lockdown? Similarly, the enormous financial instability driven by the deepest recession in living memory was contrasted with bulging personal bank accounts as people’s spending on travel, dining-out and commuting plummeted. So again, how did people’s feelings of financial wellbeing change over the year? In this post I attempt to answer some of these questions visually, presenting statistical models describing how wellbeing (across different dimensions) has varied over time and across different social groups.
Method
I investigate these questions using high-quality data from Understanding Society (UK Household Longitudinal Study), which has surveyed the same group of people continuously throughout the pandemic. The number of people in each analysis I present varies, but most are based on ~110,000 survey responses from ~33,000 people. The models are cubic growth curve models, and the code used to generate the models are provided here. All analyses control for basic demographics and regions of the UK.
We are able to observe seven time-points. The first is from a survey wave conducted before the pandemic (time 0) which can be considered a baseline comparison, mostly from 2019. Subsequent waves were in 2020, in April (1), May (2), June (3), July (4), September (5) and then November (6). Data for January 2021 will be released soon and I will update the analyses then, it will be interesting to follow these patterns into lockdown 3. For those who need a refresh, a reminder of when the UK was in lockdown can be found here.
I consider the impact of lockdown on three measures of wellbeing: general subjective wellbeing (i.e., happiness), financial wellbeing, and loneliness. General wellbeing is measured by combining 12 questions from the General Health Questionnaire (GHQ). Including questions such as “Have you recently been feeling reasonably happy, all things considered?” and “Have you recently been feeling unhappy or depressed?”. Financial wellbeing was measured by the question: “How well would you say you yourself are managing financially these days? Would you say you are...Living comfortably; Doing alright; Just about getting by; Finding it quite difficult; Finding it very difficult.” And loneliness was measured with a question “In the last 4 weeks, how often did you feel lonely?” Answers were: Hardly ever or never; Some of the time; Often. The measures are imperfect but they are some of the few measured repeatedly throughout the pandemic. To improve comparability across the three measures, in all analyses wellbeing scores are standardized so that the average is zero and the units are in standard deviations.
Question 1: How did wellbeing change over the year?
The first question is also the simplest. How did wellbeing change over the course of the year?
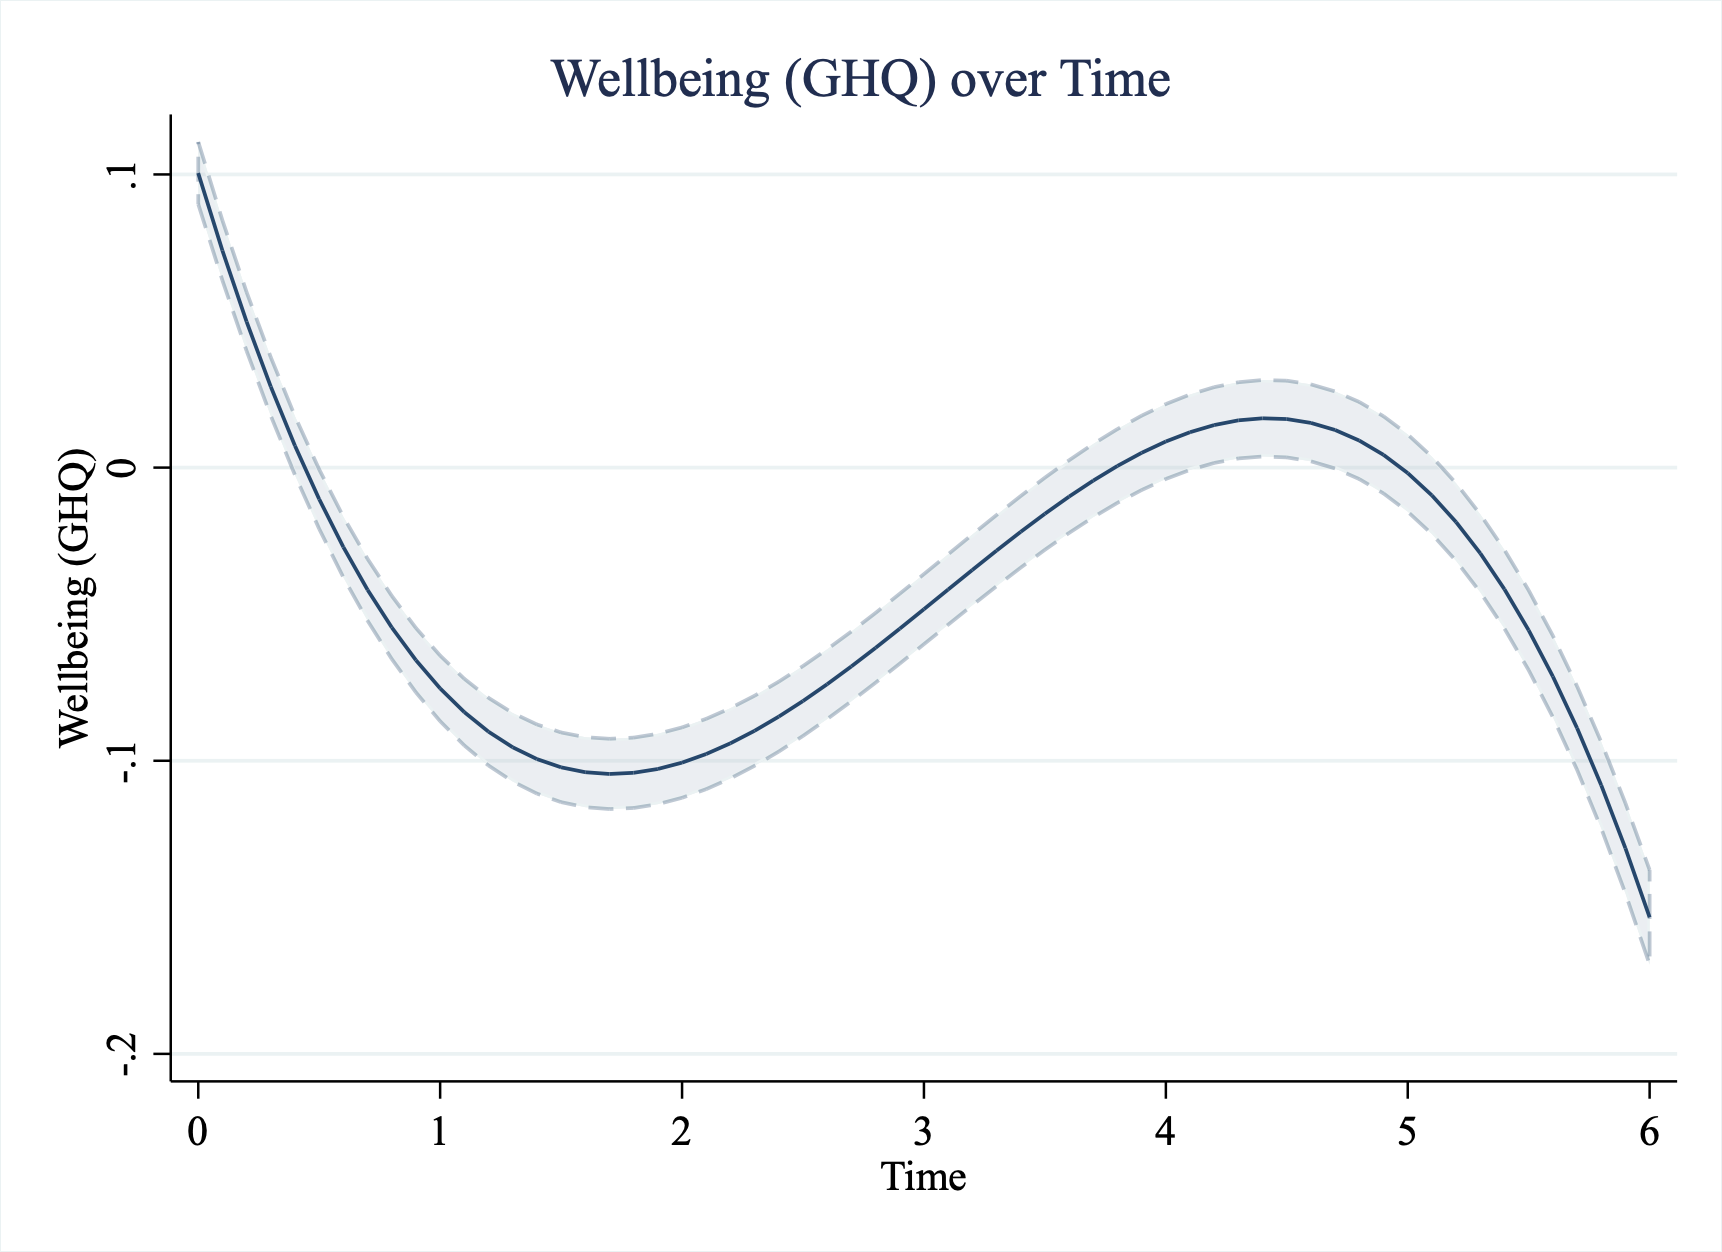
General wellbeing (happiness) followed the rhythm of the lockdowns. It declined during lockdown 1, rose when restrictions lifted and declined again during lockdown 2.
To ensure this is accurate, we can also compare this against alternative measures in the survey. In particular a question about their satisfaction with their life overall, where we see a very similar pattern of change using this alternative measure of wellbeing.
Perhaps surprisingly to some, we can see that financial wellbeing increased (on average) during the first lockdown. More people said they were living financially comfortable lives over this period than either before or after. This is likely due to the reduction in spending that took place during these months. However, financial wellbeing returned to pre-lockdown levels by the end of the year.
Paradoxically, people reported feeling less lonely over the early part of the pandemic. But this increased during the second lockdown towards the end of the year, rising higher than pre-pandemic levels. This is also likely to be driven by the weather, which allowed for more in-person socialising during the warmer summer months.
Question 2: Did younger or older people take a bigger hit to their wellbeing?
We can see younger people see a bigger change to their happiness during periods of lockdown, we see the same pattern in their financial wellbeing and sense of loneliness. It is worth highlighting that while there has been a wide focus on the loneliness of older people, those aged 20 experienced considerably greater loneliness (both during and before) the pandemic than those of older ages.
Younger people appeal to experience the greatest uplift in financial wellbeing during the first lockdown, and this may reflect the greater share of their income spent on goods and services that were closed during the first lockdown (e.g., shops, entertainment, dining out).
The models presented below treat age continuously. I am just choosing to plot the estimated level of wellbeing for people aged 20, 40 and 70 to provide a comparison.
Question 3: Did women suffer more than men?
Women appear to show stronger responses to periods of lockdown in their wellbeing compared to men. Falling during times of restrictions and rising again when the restrictions are lifted.
Loneliness in particular shows a different pattern over the year than men. While men seemed to experience slightly less loneliness during the first lockdown compared to their pre-pandemic state, women felt greater loneliness. Both groups experienced an uptick in loneliness during the second lockdown in November.
Question 4: Did any gender differences vary by age group?
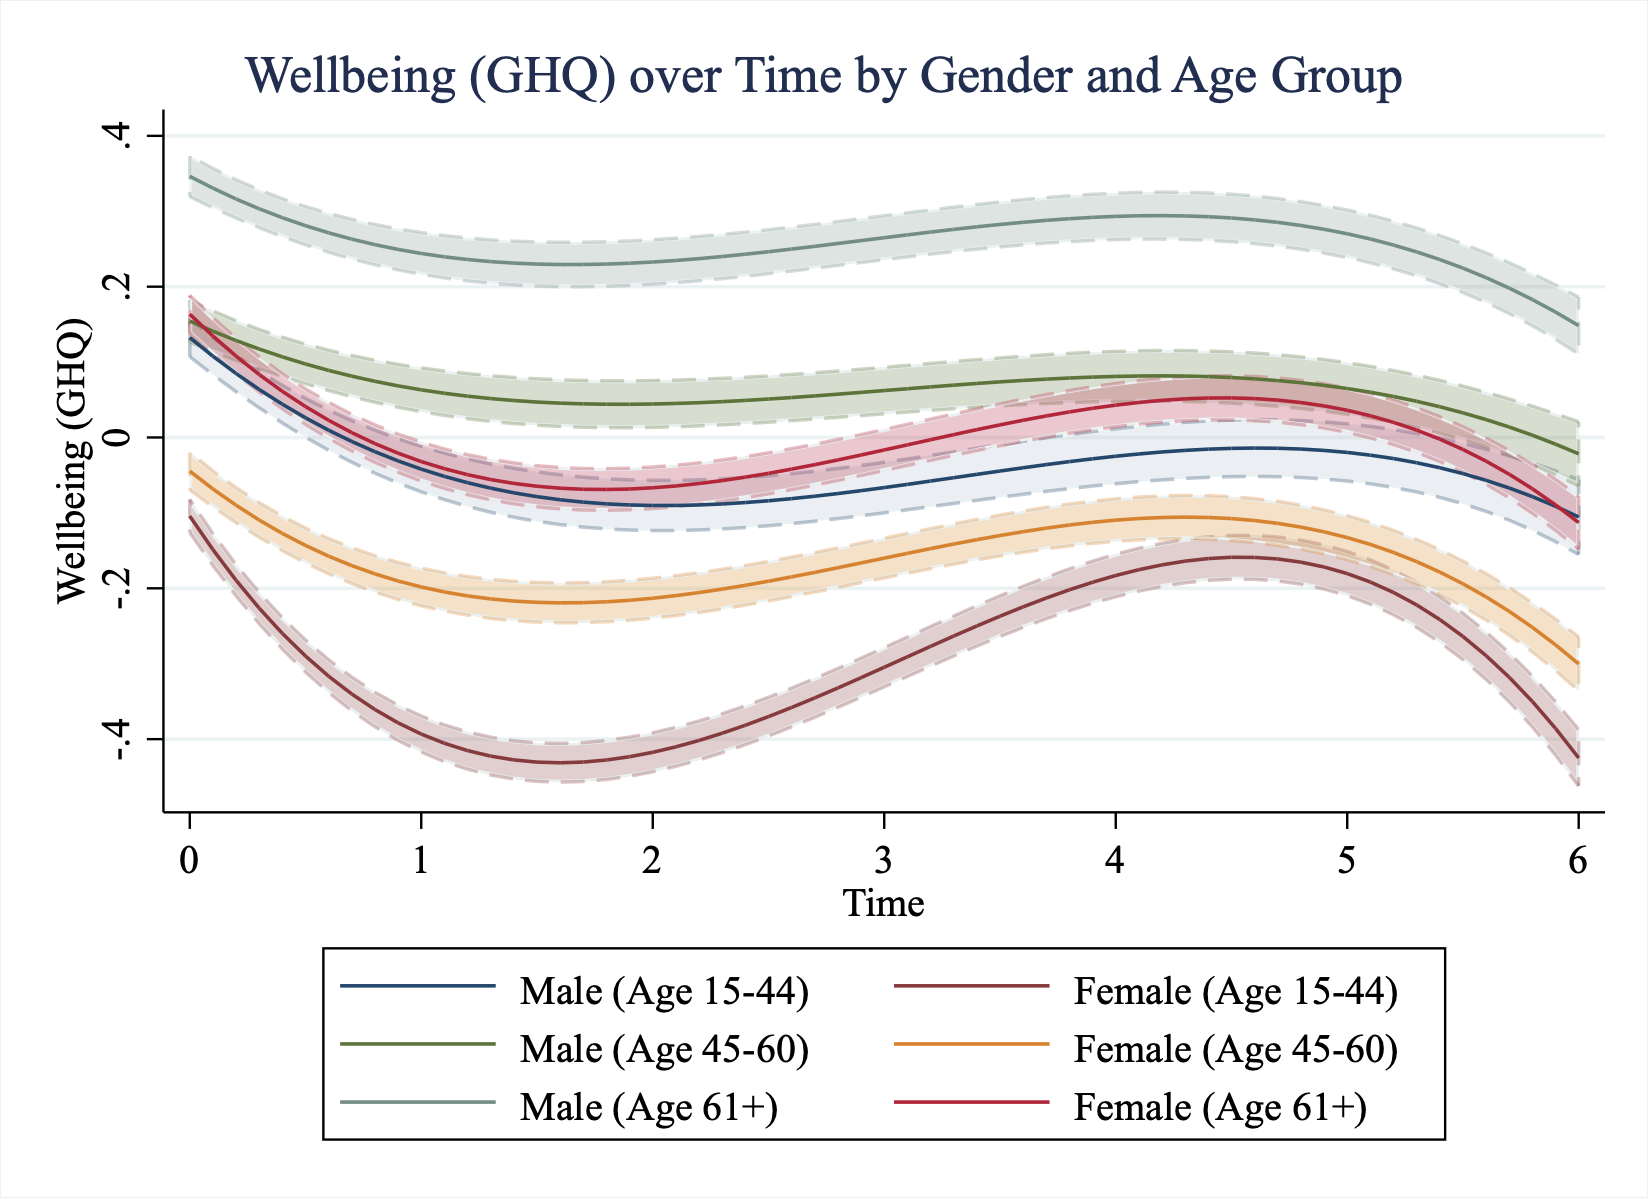
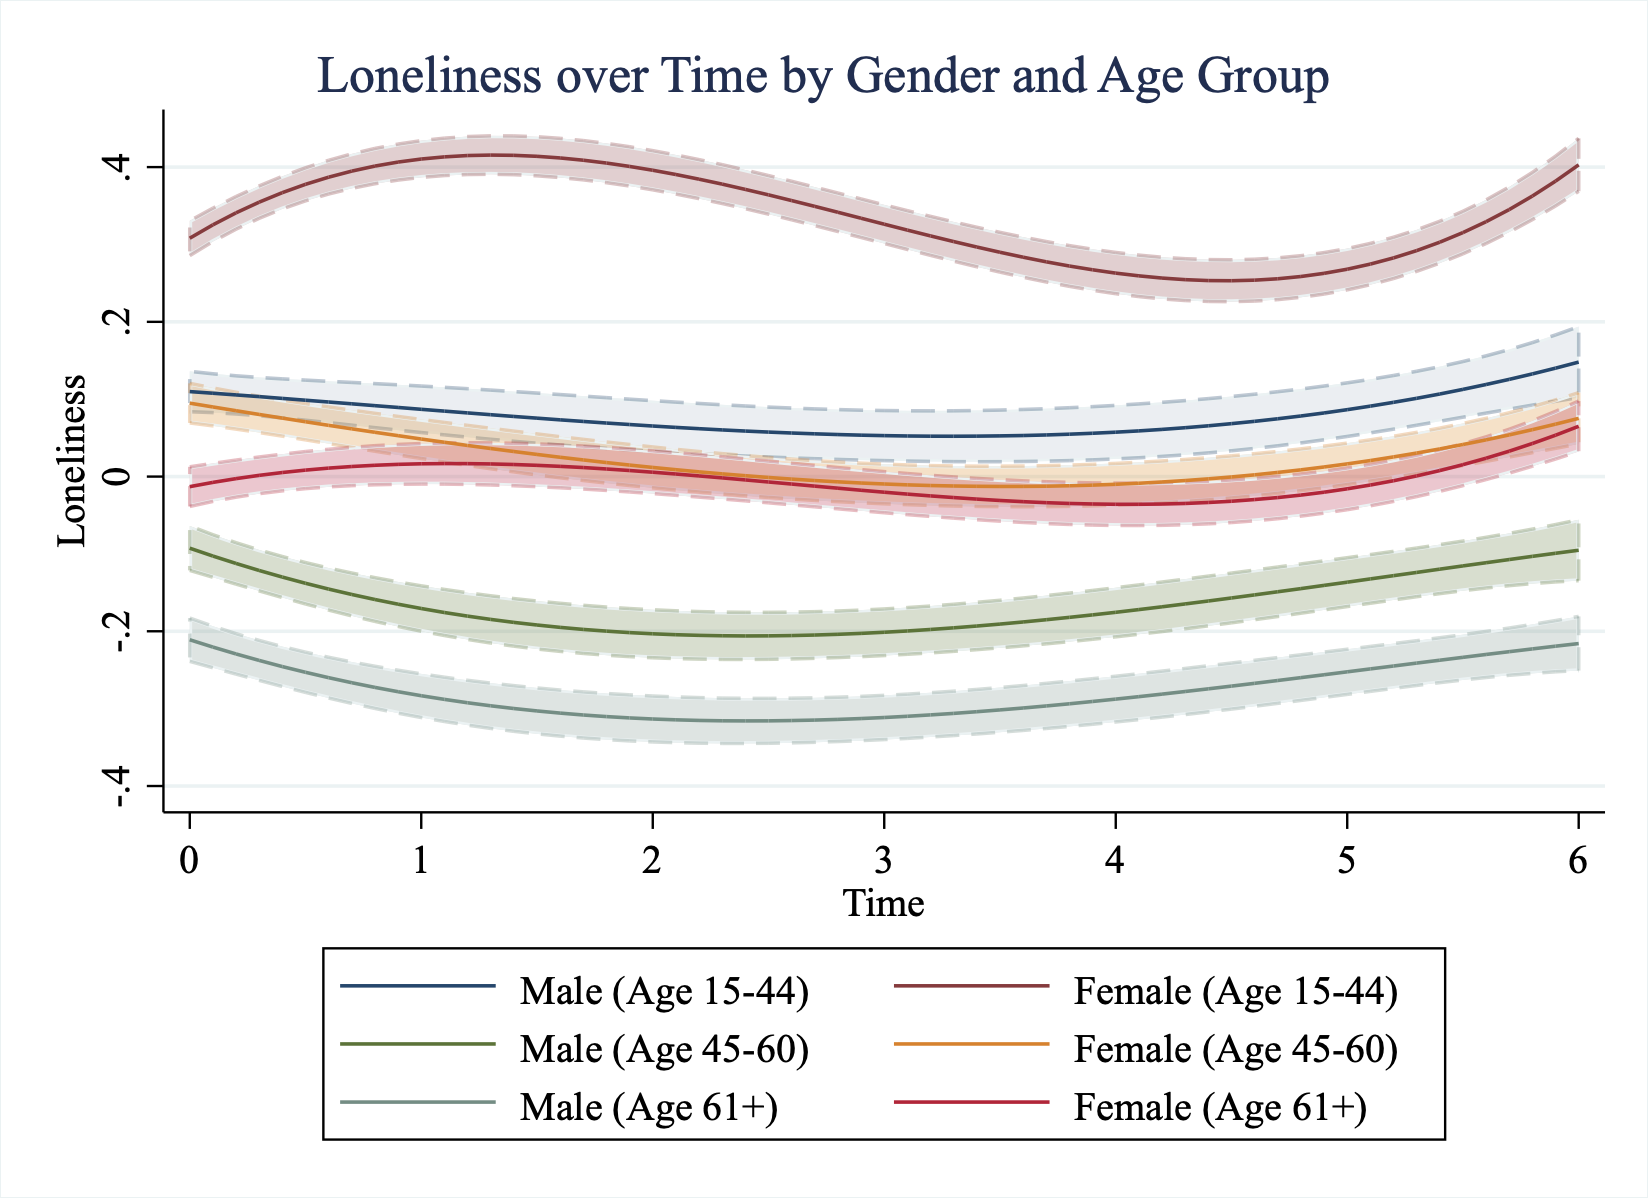
Looking at gender differences or age differences alone may obscure important differences in how gender and life stage lead to differential responses to the pandemic. In this analysis, rather than treating age as continuous, the analysis creates three equally sized buckets of the population: those aged 15-44, 45-60 and 61+.
Younger women see by far the largest change over the year, following the pattern of lockdown., particularly in terms of their general wellbeing (happiness) and their feelings of loneliness. We again see men experiencing a neutral or even positive response to the lockdown period compared to women.
Question 5: Did single people suffer more than couples? [Part 1]
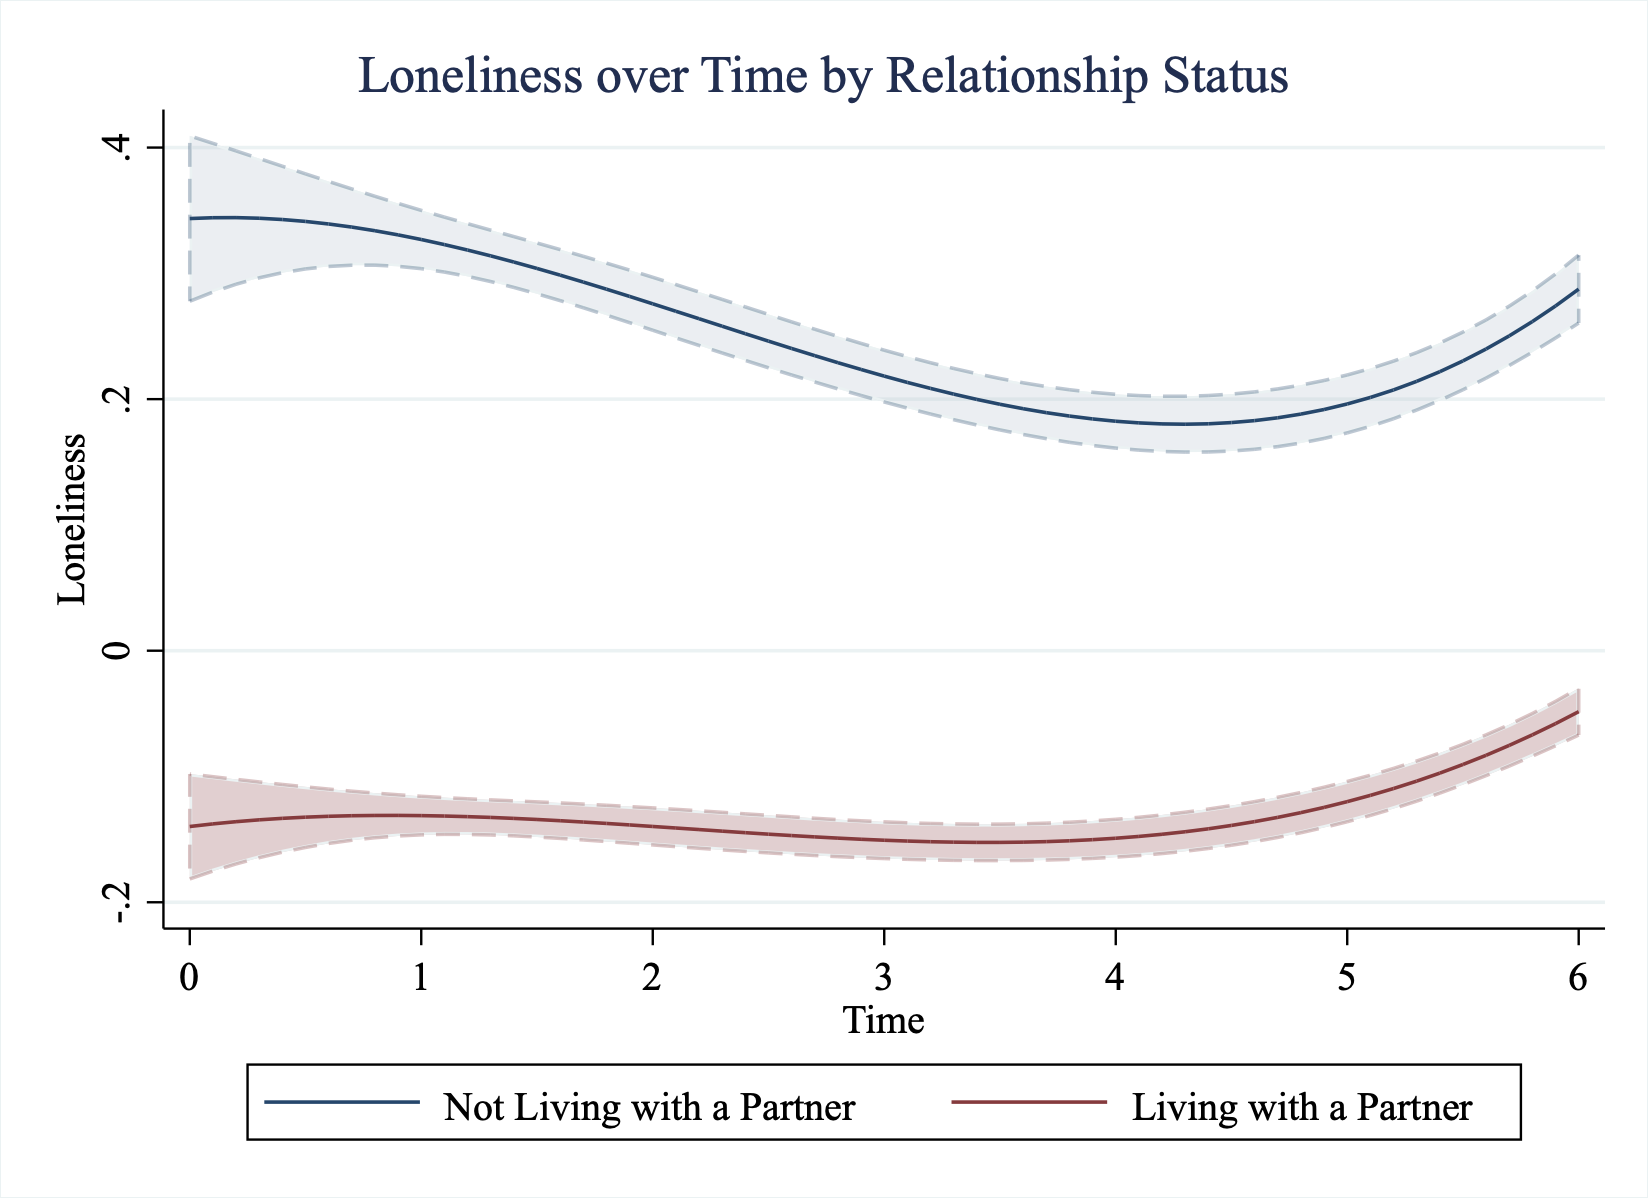
These models split the sample into those living with a partner and those not living with a partner. I present an analysis after this looking at the same question with household size.
While general wellbeing is not statistically distinguishable pre-pandemic (time 0), differences grow after the onset of the pandemic. However, both groups seem to benefit and suffer to similar degrees during periods of lockdowns.
Those not living with a partner feel considerably greater loneliness (including before the pandemic started). Though they appear to feel less lonely over the course of the pandemic. Both groups feel lonelier during the second lockdown.
Question 5: Did single people suffer more than couples? [Part 2]
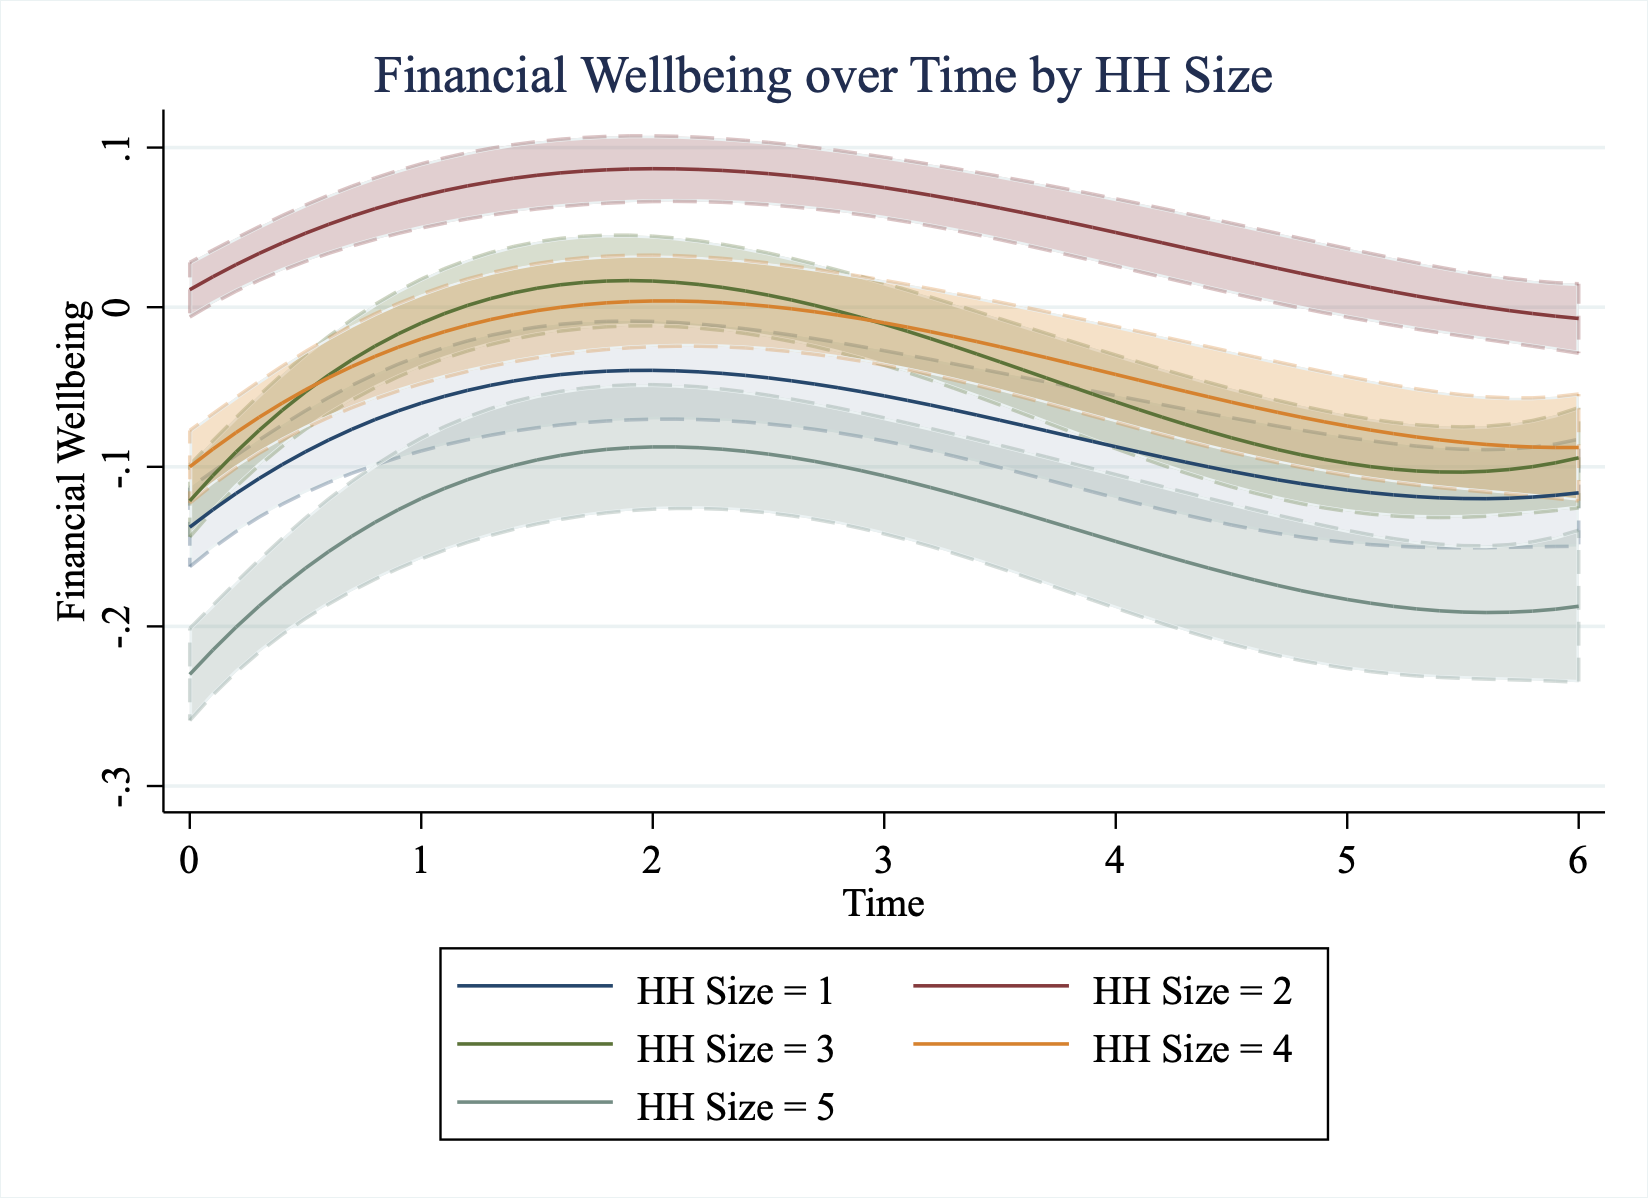
Living with a partner is not the only household formation that is likely to protect against loneliness. We repeat the same analyses looking at household size.
We again see that those living alone experience the lowest general wellbeing, but they follow the same pattern as other types of household over the year.
Those living alone experienced much greater loneliness, and this seemed to change more as lockdown was imposed or lifted compared to households of other sizes.
Question 6: Were some Regions of the UK more Impacted than Others?
Finally, we looked at how wellbeing changed by region. This time we are using an alternative measure of general wellbeing (satisfaction with life), as it shows an interesting pattern for London; which was similar in wellbeing to other regions before the pandemic, but felt less happy over the course of the year. Perhaps this is due to greater overcrowding, smaller housing units and people not having access to gardens.
We also see that while Londoners on average had lower financial wellbeing, likely due to the comparably higher cost of living, changes in financial wellbeing followed a similar pattern across regions over time.
Conclusion
The pandemic has not impacted everyone equally and so it’s important to try and understand the wellbeing effects on social groups using data rather than only anecdotes and stories.
The results are simply descriptions of correlations over time. It is not possible to make any claims that the lockdown itself caused any of these changes in wellbeing.
Younger women seem to show the most dramatic declines in wellbeing under lockdown, especially the impact on their feelings of social connection. Given they are a group who have an extremely low risk of suffering health effects from the virus, their contribution to keeping the virus under control should be recognised.
As the world continues to battle the virus, more lockdowns are likely to be imposed. And findings like these might help to allocate resources or estimate the impact across social groups.
Interestingly, not all patterns fit a simplistic narrative of the year. While general happiness declined, feelings of financial wellbeing and social connection rose during the lockdown.

